
Retail
How Planogram Software Decides What Goes on Which Shelf, and When
A planogram is a retailer's diagram of every facing, shelf level and sequence in a fixture — and the reason two stores in the same chain look identical.
Retail covers the delivery end of the industry: physical layout, online sizing tools, fit prediction, returns handling and the inventory choices that leave a rack permanently marked down. Coverage includes what a single return actually costs a company. Useful for readers in buying, merchandising or e-commerce.
A planogram is a retailer's diagram of every facing, shelf level and sequence in a fixture — and the reason two stores in the same chain look identical.
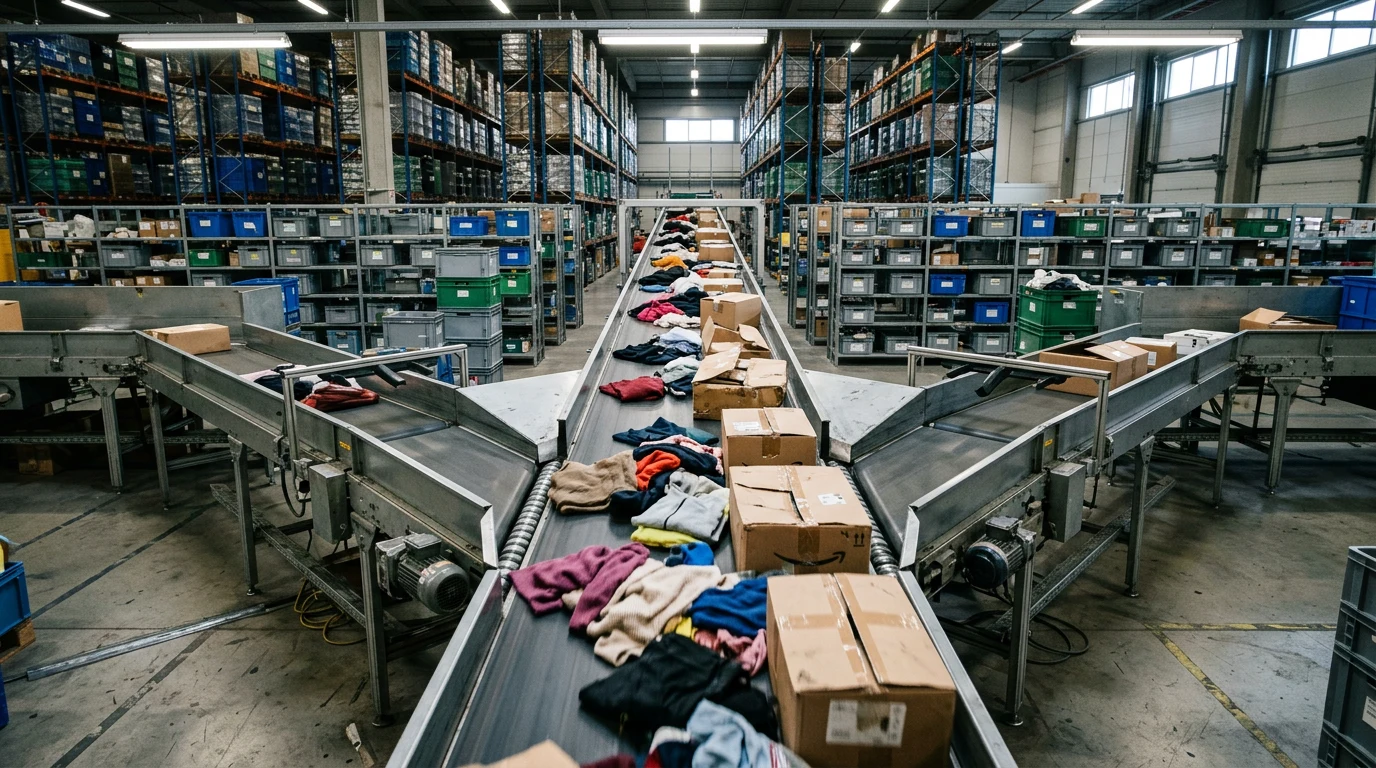
Returns now run at 15.8 percent of U.S. sales and 19.3 percent online. Mail-in fees price the reverse leg, and California's textile EPR law prices what happens after it.
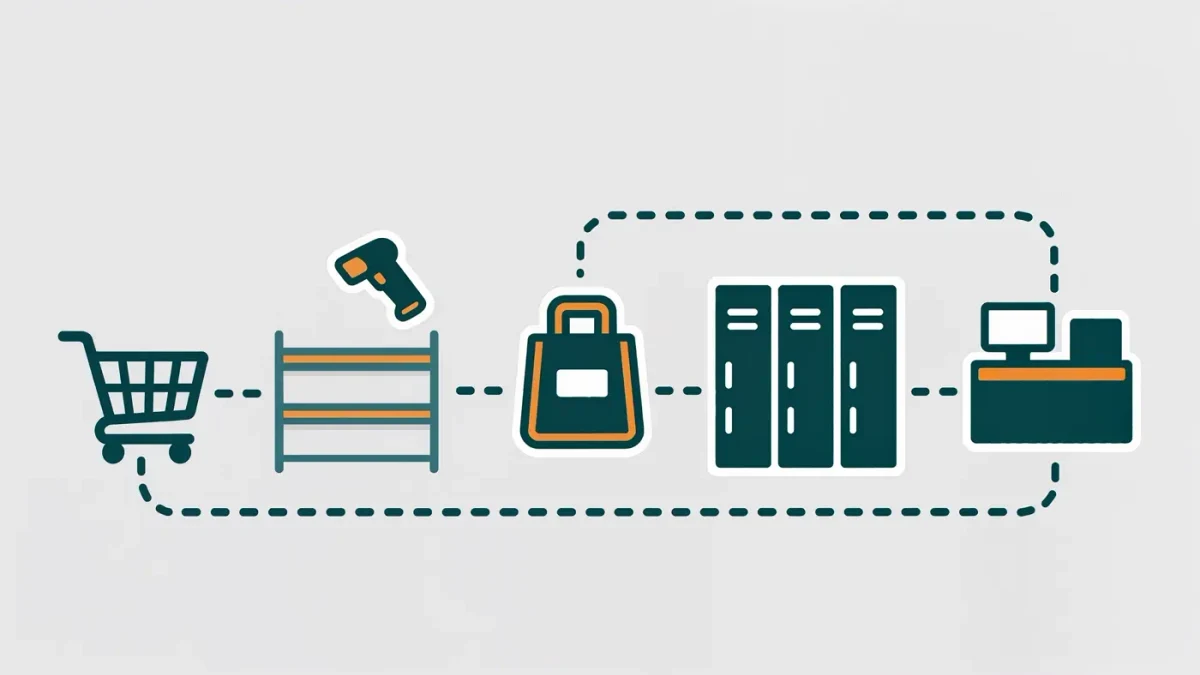
Buy online, pick up in store looks free to the customer and costs a store a sequence of small labours: the pick, the stage, the handover, and the occasional no-show.

Behind every covered register is a scheduling system balancing traffic curves, labour laws, student timetables, and the persistent gap between the plan and who shows up.
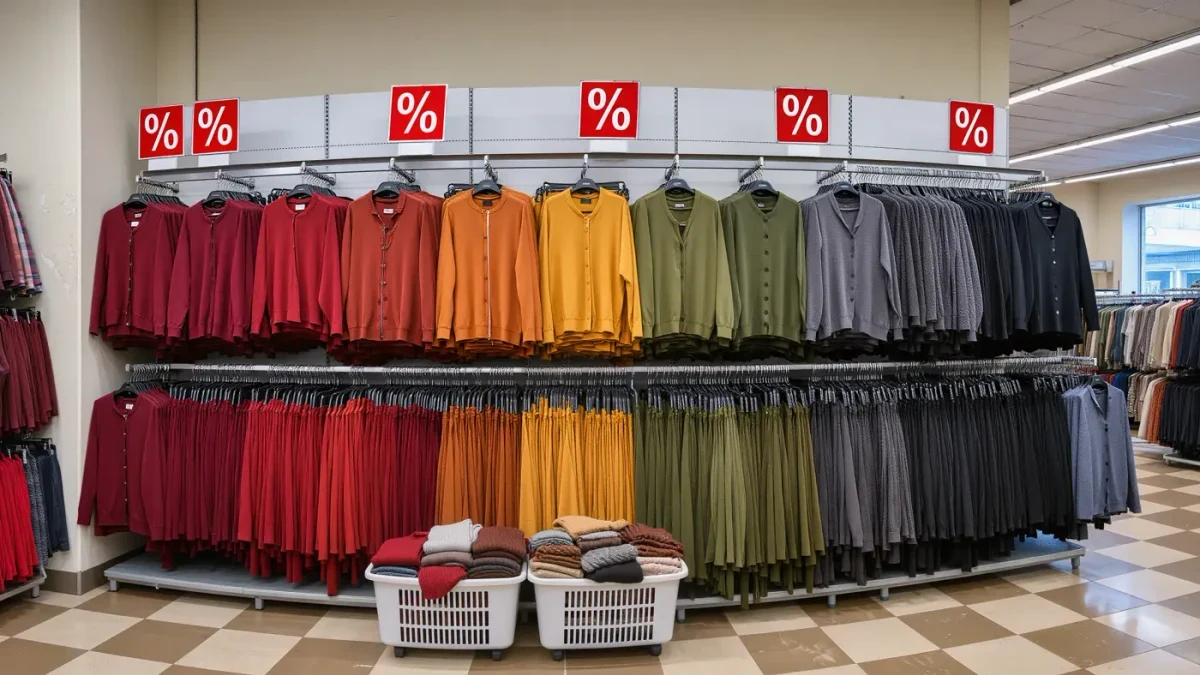
A clearance corner that never clears changes more than prices: it rewires customer expectations, staff behaviour, and the arithmetic of everything sold at full price nearby.
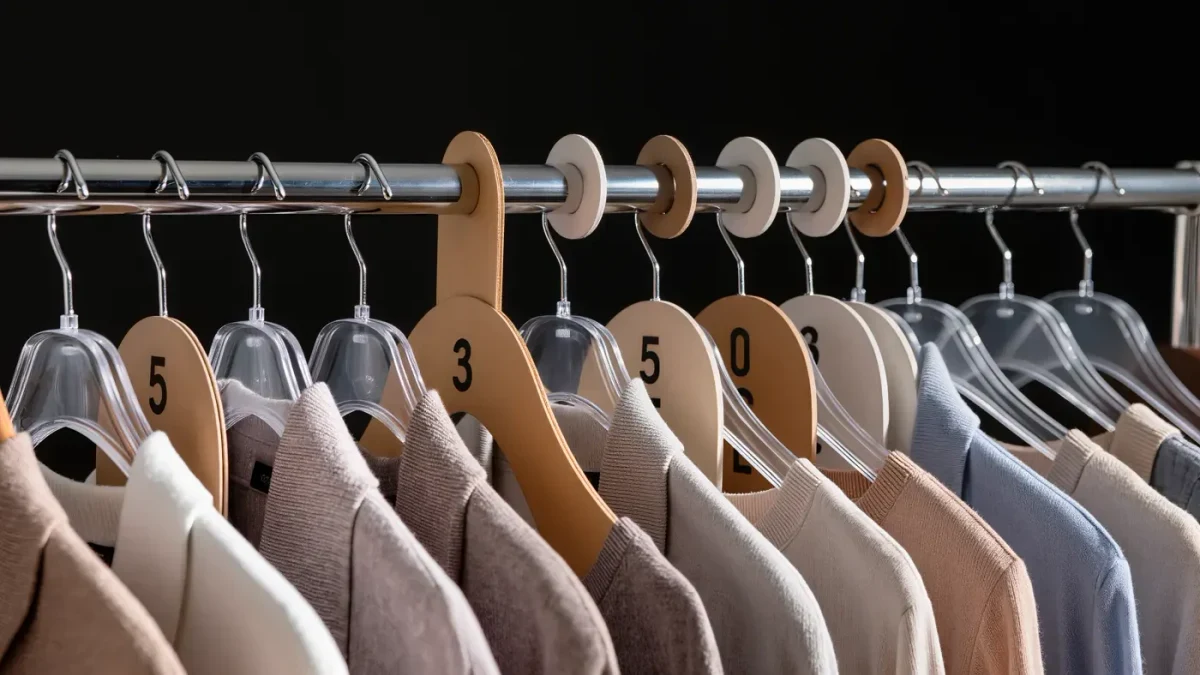
Stock turn is the quietest ratio on an apparel balance sheet, and reading it well means matching the number to the format rather than to a single industry figure.